
Exploratory Data Analysis (EDA) is a crucial step in the data science process. It involves analyzing and summarizing a dataset to gain insights and understanding of the data. In this blog, we will discuss how to perform EDA on the Titanic dataset in Python.
The Titanic dataset is a well-known dataset that contains information about the passengers who were on board the Titanic when it sank in 1912. It includes information such as the passenger’s name, age, gender, class, and whether they survived or not.
To begin, we will import the necessary libraries, including pandas, numpy, and matplotlib. We will also load the Titanic dataset using the read_csv() function from pandas.
import pandas as pd
import numpy as np
import matplotlib.pyplot as plt

data = pd.read_csv('titanic.csv')
First, we will take a look at the overall structure of the dataset by using the head() function from pandas, which returns the first few rows of the data.
data.head()
We can also use the info() function to get a summary of the dataset, which includes information about the number of rows, columns, and the datatype of each column.
data.info()
Next, we will analyze the distribution of the target variable, which is the ‘Survived’ column. We can use the value_counts() function from pandas to count the number of survivors and non-survivors.
data['Survived'].value_counts()
We can also visualize the distribution of the target variable using a bar plot.
sns.countplot(data=data, x="Sex", hue="Survived")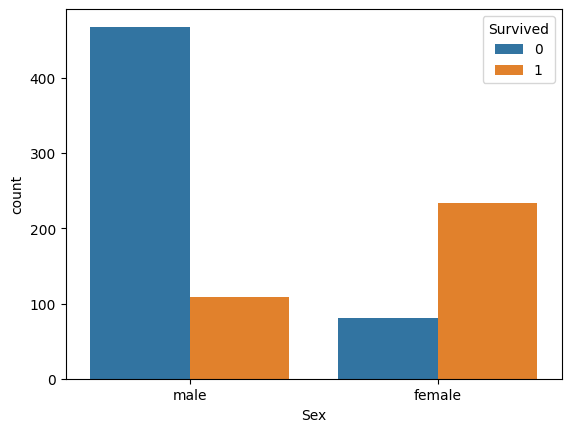
The survival ratio of females are greater than that of males.
sns.barplot(y="Survived", x="Pclass", data=data)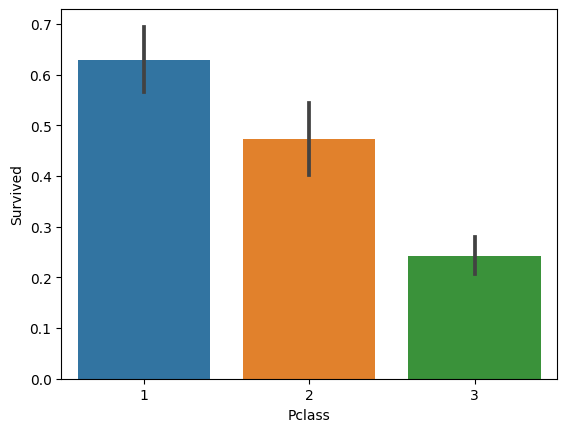
It’s clear that people with first class tickets had higher survival rate, as shown in the above graph
data['Family_Size'] = 0
data['Family_Size'] = data['Parch'] + data['SibSp']

# Adding a column Alone
data['Alone'] = 0
data.loc[data.Family_Size == 0, 'Alone'] = 1

# Factorplot for Alone
sns.barplot(x='Alone', y='Survived', data=data)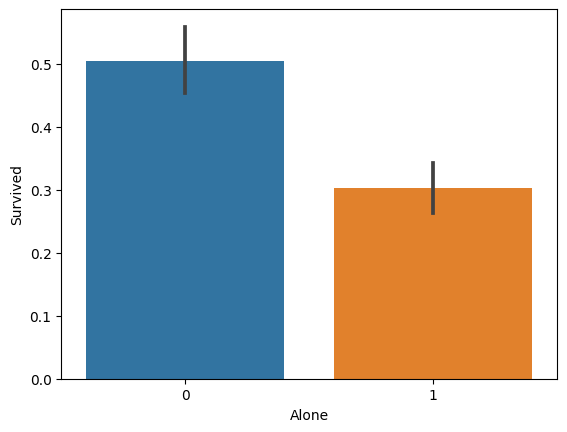
It’s clear that passengers travelling alone had lesser survival rate, as shown in the above graph
sns.violinplot(x="Sex", y="Age", hue="Survived", data=data, split=True)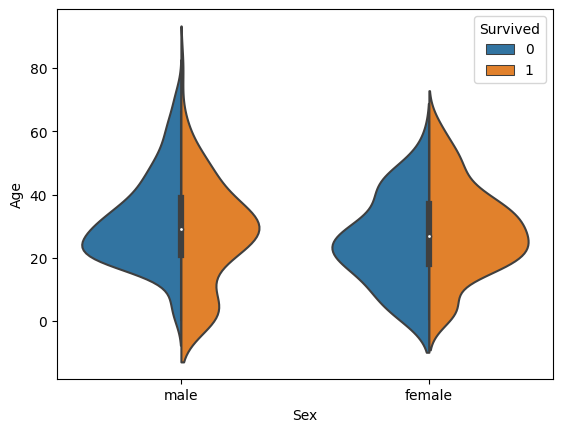
Men of age 15-40 didn’t survive the most. Whereas, Women of age 15-50 had a higher survival rate
You can find the notebook of above blog in my GitHub repository.
This graph summarises the age range of men and women. Observations are:
1. Children's survival rates are good in males than in females
2. Women of age 15-50 had a higher survival rate
3. Men of age 15-40 didn't survive the most
In conclusion, the Titanic dataset provides a wealth of information about the passengers who were on board the Titanic when it sank in 1912. Through Exploratory Data Analysis, we were able to gain insights into the structure of the dataset and the distribution of the target variable, which is the ‘Survived’ column.
Some of the key findings from EDA include:
1. There are 891 rows and 12 columns in the dataset.
2. Some columns have missing values, such as Age, Cabin, and Embarked.
3. The majority of the passengers (about 61%) did not survive the sinking of the Titanic.
4. The passenger class, fare, and age are correlated with the survival rate. Passengers in the first class, who paid higher fares, and children had a higher chance of survival.